One of the coolest features of Windows is the ability to develop software for Linux distributions. WSL is turning Windows into the Swiss army knife of multi-platform development by offering a Linux environment within Windows. Due to this, C++ and CMake applications are really easy to be developed under WSL and VSCode. With Visual Studio Code, it’s also very easy to compile and debug C++ code.
In this post, we look at how to completely turn VS Code into a fully-fledged C++ IDE by debugging your CMake programs with it!
Video – Debugging with VS Code
If you’re more of a visual learner, the video below shows how to debug a C++ / CMake project on WSL with VSCode.
Additionally, the project used in the video, as well as the final contents of the launch.json file are shown in the sections below.
Extensions Needed For VSCode
Initially, if you haven’t used VSCode for C++ projects on WSL, you will need to install a few extensions, so everything runs smoothly. For this reason, the list below contains the names of all extensions you need to install, and the reason for each one.
- Remote WSL: This extension allows you to open workspaces from your WSL installation. Once installed, you can navigate to the directory you want in your WSL terminal, and simply type
code .to open it as a VSCode workspace. - CMake Tools: This Microsoft extension enables the support for CMake projects in VS Code, it will allow you to configure and build your CMake projects.
- C/C++: Enables C++ language support for Visual Studio Code (syntax highlighting, etc).
- C/C++ Extension Pack: Includes some of the extensions mentioned in this section, and a few more. Interestingly, this extension pack contains all of the “nice to have” extensions for C++ development, such as CMake syntax highlighting, C++ syntax colour schemes, etc.
Finally, if you haven’t installed extensions in VSCode before, simply click on the extension UI button ![]() , search for the extensions we mentioned, and install them!
, search for the extensions we mentioned, and install them!
Tools Needed For Your WSL Installation
Similarly, you will also need to install a few tools in your Linux distribution on WSL. If you haven’t already got them, install the tools shown in the list below so you can develop C++ applications on WSL.
- GCC/G++ compiler: the C++ compilation tools.
- GDB debugger: the equivalent debugger for your compiler.
- Make: build system to be used by CMake.
- CMake: yes.
Interestingly, each Linux distribution has a different way of installing packages. For example, if you’re on Ubuntu, running sudo apt-get install gcc will install the compiler. You can similarly install the other tools in that way.
However, I recommend googling “how to install X” for your Linux distribution, so you can get the right terminal command for the installation. For example, “how to install make on Manjaro” on Google may tell you to run sudo pacman -S make.
Opening The Test Project On VSCode
For this example, we’re using the project created for the post about integrating Google Tests into CMake. Therefore, if you would like to work with the same examples mentioned here, visit the link and download the project to your WSL.
Once you downloaded the files to WSL, navigate cd into the fetch-content directory in the repository, then simply type code .. If you installed all the Visual Studio Code extensions correctly, VSCode should pop up with fetch-content as your workspace.
Debugging Your C++ / CMake WSL Project With VSCode
Without further ado, let’s see how we can use VSCode to debug our C++ project. In this section, we look at how to debug C++ application created for Linux under WSL, all within VSCode.
Configure And Compile Your CMake Project On Visual Studio Code
Firstly, make sure you can configure and compile your CMake project on VSCode. After pressing CTRL + SHIFT + P, search and select each of the items in the list below. Make sure to follow the instructions for each option!
- “CMake: Select a Kit” – once you select this option, a dropdown menu of compilers will show up. Simply select the
GCCoption, which is the compiler we previously installed. - “CMake: Configure” – select this option to configure your CMake project. CMake will create the “build” directory and place all CMake files under that directory.
- Compile with “CMake: Build” – interestingly, once this is done you will find all your programs and libraries under the “build” directory. Essentially, CMake mirrors the structure of your main project, so all executables and libraries will be where they were created in the original CMakeLists.txt files.
It’s worth noting that the above instructions should work for any CMake project. For this reason, whether you’re using the example project mentioned in this post, or your own custom project, the instructions will achieve the same thing.
Writing A launch.json File For VSCode
This is the meat and potatoes of debugging in Visual Studio Code. Writing a launch.json file is necessary to tell VSCode how to debug your project: which program to run, where to find the debugger, what arguments to give your program, etc.
To create the launch.json file, select the “run and debug button” ![]() , and then click on “create a
, and then click on “create a launch.json file”.
Due to installing the C/C++ extensions on VSCode, you should be able to add a default debug configuration. Specifically, you can click on the blue “add configuration” button on the bottom right. If you’ve installed all the extensions correctly, you should be able to select “C/C++: (gdb) Launch”. However, you don’t need all of the options VSCode sets up by default.
To simplify things a little bit, the following Json block shows a minimalist launch.jsonthat should be enough to debug an executable.
{
    "configurations": [
        {
            "name": "TestZeroZero",
            "type": "cppdbg",
            "request": "launch",
            "program": "${workspaceFolder}/build/tests/multiply_test",
            "cwd": "${fileDirname}",
            "miDebuggerPath": "gdb",
            "args": [
                "--gtest_filter=MultiplyTests.TestIntegerZero_Zero"
            ],
            "environment": [
                {
                    "name": "GTEST_COLOR",
                    "value": "0"
                }
            ]
        }
    ]
}
Unsurprisingly, there are many options you can add to each configuration above. For this reason, if you want to know more about the options, simply start typing the quotes inside a configuration above, and VSCode will show you the documentation!
Options Used In The Minimalist VSCode’s launch.json Debug Configuration
Essentially, inside the “configurations” array, there’s an object for each debug configuration.
You can think of these configurations as the settings for each debug session. For example, if you want to debug a particular test executable in your project, you will create a configuration for it. A configuration will provide the path to the program you want to debug, arguments to pass to it, working directory, etc.
The list below explains what each of the options used in the configuration above means.
- name – The name of the configuration, this appears in VSCode’s UI, see section below.
- type – The debug type. If you installed all the C/C++ extensions properly, you should be able to add “cppdbg”.
- request – For C++, you can have “launch” or “attach”. If you want to debug an executable your project creates, then “launch” will call that executable in debug mode. On the other hand, “attach” will attach the debugger to a running process, and if your code is called from the process, you will be able to debug it.
- cwd – The working directory for the debugging session, i.e. where your program will run from.
- miDebuggerPath – The path to the debugger. If you installed GDB correctly, simply put “gdb” here.
- args – Extra command line arguments to send to your program. This is simply an array of strings in Json.
- environment – Environment variables to set for the debugging session. This is an array of
{"name": "env_name", "value": "env_value"}objects.
Running The Debug Session
If you added the all the necessary contents to launch.json , you should now see your debub session under the “Run and Debug” tab.
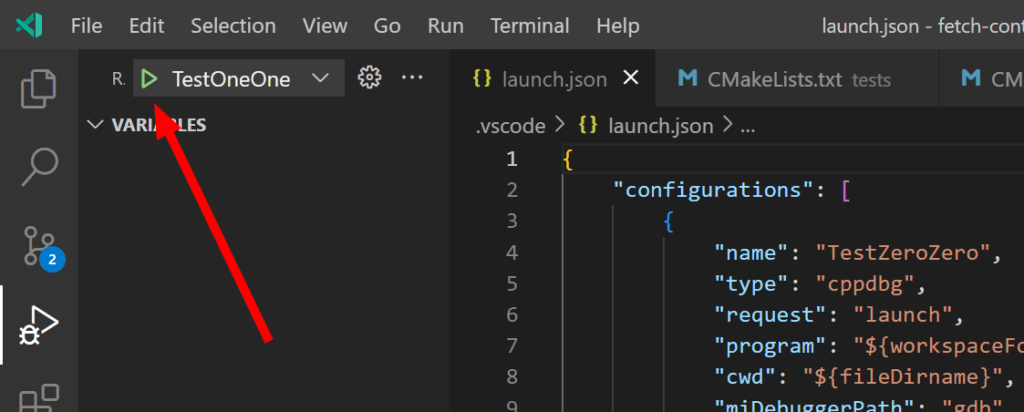
For the finale, just add a breakpoint somewhere in your code, and click on the run button! In my case, I added breakpoint to my unit tests. Unsurprisingly, the breakpoints were hit, and I could see what’s going on inside my tests!
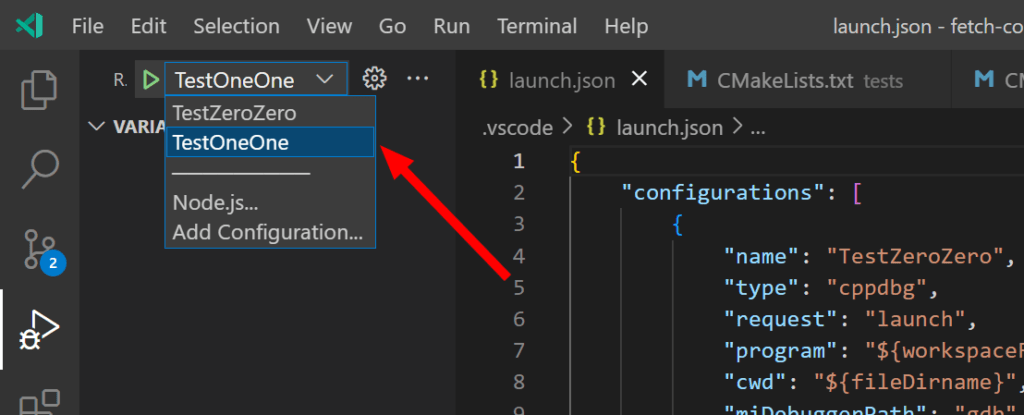
Multiple Debug Sessions? Multiple Executables To Test? Let’s Add Multiple Configurations!
Adding more configurations is easy. Just copy and paste a configuration object and make a few changes for the new debug session. Don’t forget to add it in the correct “configurations” array!
For example, the code block below shows the launch.json contents for two different sessions.
{
    "configurations": [
        {
            "name": "TestZeroZero",
            "type": "cppdbg",
            "request": "launch",
            "program": "${workspaceFolder}/build/tests/multiply_test",
            "cwd": "${fileDirname}",
            "miDebuggerPath": "gdb",
            "args": [
                "--gtest_filter=MultiplyTests.TestIntegerZero_Zero"
            ],
            "environment": [
                {
                    "name": "GTEST_COLOR",
                    "value": "0"
                }
            ]
        },
        {
            "name": "TestOneOne",
            "type": "cppdbg",
            "request": "launch",
            "program": "${workspaceFolder}/build/tests/multiply_test",
            "cwd": "${fileDirname}",
            "miDebuggerPath": "gdb",
            "args": [
                "--gtest_filter=MultiplyTests.TestIntegerOne_One"
            ],
            "environment": [
                {
                    "name": "GTEST_COLOR",
                    "value": "1"
                }
            ]
        }
    ]
}
The first session runs the multiply_test executable with a certain unit test running, and no GTest color due to GTEST_COLOR environment variable being off. Similarly, the second session runs the same executable, but a different test and GTest colour output enabled.
If you have a different executable, you will need to have a different configuration with the corresponding “program” value.
That’s it, you can now debug your project with VSCode! Happy debugging!
Have I missed something? Do you have feedback or questions? Did you spot a typo? Feel free to comment below!
Be First to Comment